
Candlestick Basics: Reading Price Without Indicators
Technical analysis · 5 min read · October 2026
Every candlestick is a compact story: where price opened, how far buyers pushed, how far sellers pushed back, and where it settled. Learn to read that story and you need fewer indicators, not more.
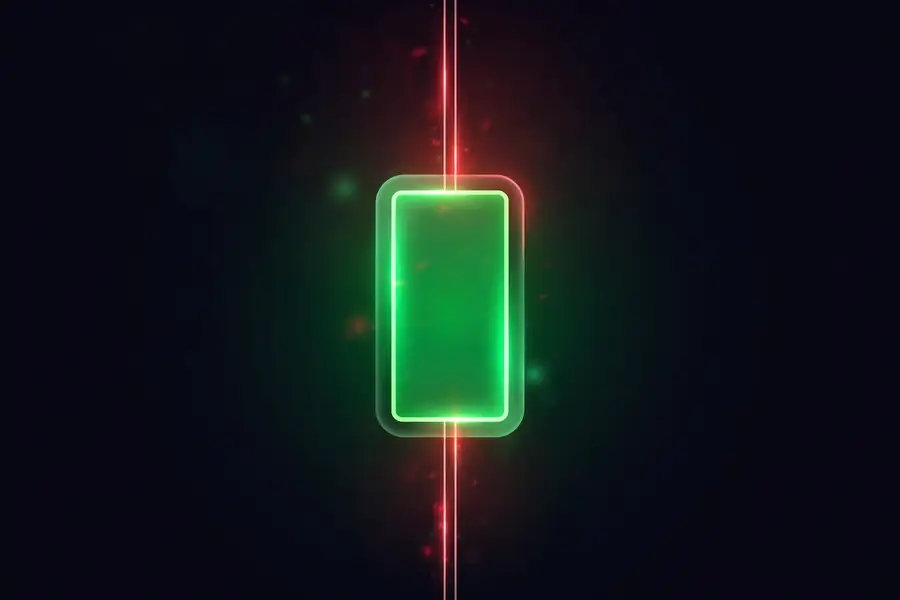
Anatomy of a candle
- Body — open to close. A long body means conviction; a small body means indecision.
- Wicks (shadows) — the full high-low range. A long upper wick shows buyers were rejected; a long lower wick shows sellers were rejected.
- Color — close above open (typically green) or below open (typically red). Direction of the battle's outcome.
The few patterns worth knowing
Forget memorizing fifty patterns. Three cover most of what matters:
- Engulfing — a candle whose body fully covers the prior candle's body. At support or resistance, it signals a shift in control.
- Pin bar / hammer — small body with a long wick. Rejection of one side; meaningful only at key levels.
- Doji — open ≈ close. Pure indecision; a pause sign, not a trade signal by itself.
Context beats shapes
A perfect engulfing candle in the middle of a range means little. The same candle at a level where price reversed twice before means a lot. Candles describe what happened; market structure tells you where it matters. Always read the two together — and never trade a candle pattern without a stop beyond its extreme.